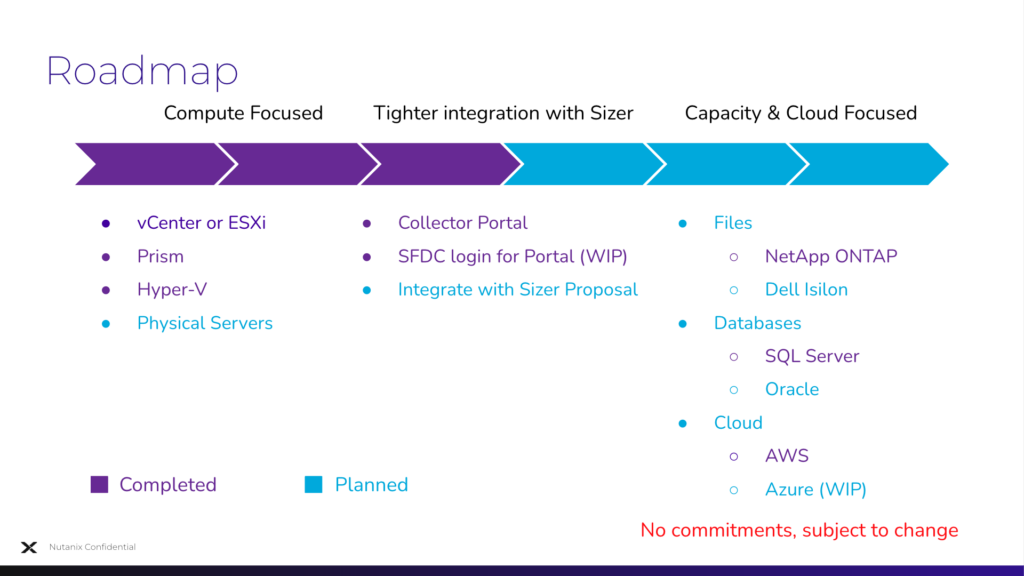
Collector Roadmap
Just another WordPress site
This page aims to address most of your queries with regards to Nutanix Collector. While we are happy to engage in insightful conversations over the slack channel, we request you to please go through the FAQs on this page before reaching out to us via slack or email.
Prospects and Customers can access Collector in a few ways:
Download Collector via Collector Login Page as seen in the screenshot below:
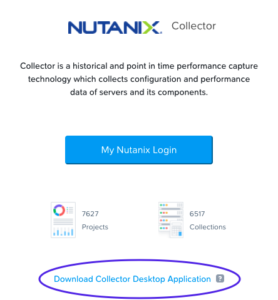
Collector Public Download Link – no registration required
Collector Download Link for MyNutanix Users
The last approach via MyNutanix registration would also give our users access to the Collector Portal.
You can report issues in Collector by filling this Google form. The form can also be accessed by customers, prospects, and partners.
Replicates the exact same view as seen by your prospect or customer
Share and Collaborate with peers, customers/prospects, capacity planning experts for improved sizing.
Collector Portal is enhanced on a regular basis to add more value – for example, VM provisioning status, VM list tab with the consolidated view, etc.
Data gathered by Collector across 200K+ VMs says 90+% of VMs are over-provisioned
Collector contains data gathered from the customer or prospect data centers and hence the data gathered by customer or prospect is not accessible by anyone unless the data is explicitly shared.
There are a few ways to request data from your customer or prospect:
You can create a Project using the Collection zip file. For detailed steps, please refer to “Creating a Project” in the Collector Portal User Guide available here
We have simplified the process of inviting users to the Collector Portal. If you have an existing project which you want to share, just go ahead and share the project with them. If the user is not registered on Collector Portal, we will identify the same and then invite the user and share the project via 1-click.
If you want to invite users without sharing any projects, please use the “Invite” option present within the top right section under the “Summary” page of Collector. For more details, please refer Collector Portal User Guide available here
Please refer to this Portal link for User Guide, Release Notes, and Security Guide.
We have a flyer that is currently a work in progress – “Capacity Planning Data Collection in 30 seconds”. We will update this FAQ once the collateral is ready. Draft version available now – Collector in 30 seconds
In the case of vCenter/ESXi or Hyper-V, the data includes CVM resources. Please ensure to turn off the CVMs before sizing to ignore the resources consumed by CVM.
In the case of Prism/AHV, the data does not include CVM resources as these are not needed for sizing. At the same time, we plan to enhance Prism/AHV to optionally show resources along with CVM.
Yes, if you happened to use Collector Portal and exported to Sizer. Recently, we have introduced the ability to view all the related sizings associated with the Collector Project. This mapping would be extremely beneficial in case of any customer satisfaction issues where the workload has changed pre and post-deployment.
Collector automatically considers the CPU based on the data gathered from the existing customer or prospect environment and hence the processor selection options are disabled. In the future, we plan to enhance UI to make this more intuitive.
There are a couple of ways in which you can selectively turn off or on certain VMs before sizing via exported XLSX file.
If you using XLSX export in Sizer and want to power OFF a few VMs, you need to make a couple of changes:
a) In the “vInfo” sheet, edit the ‘Power State’ column value from “poweredOn” to “poweredOff”.
b) In the “vCPU” sheet, clear the values of the mentioned columns for the VMs that you desire to turn off – ‘Peak %’, ‘Average %’, ‘Median %’, ‘Custom Percentile %’ and ’95th Percentile % (recommended)’
Save the sheet and import data in Sizer.
Note: If you miss (b) you may see the below error:
Data being imported contains one or more VMs that were powered ON during the collection period and reported CPU utilization.
We recommend you to size both Powered ON & Powered OFF VMs.
Similar to turning off/on the VMs, you can selectively specify the target cluster before sizing.
If you are using Collector Portal, you can go to the “VM List” tab and edit the ‘Target Cluster’ field before exporting the data to Sizer.
If you using XLSX export, you can edit the ‘Target Cluster’ column under the “vInfo” sheet and save it before importing data in Sizer.
You can also edit multiple VMs in one go via “Bulk Change” option.
Unfortunately, this is not possible via Collector Portal but you can do it directly in Sizer using the Import Workload functionality.
If you have the Collector XLSX file please import the individual project XLSX files in Sizer one by one within the same Sizer scenario.
You can get the XLSX from the Collector portal using the “Export to XLSX” functionality.
Yes, there is a detailed help page documenting various options available when exporting to Sizer, guidance, and caveats around the same. Please here the same here – Exporting Collector Data to Sizer
We plan to merge Sizer & Collector Portal in the future. But for now, there are a couple of workarounds to access the Sizings created via Collector Portal in Sizer when using Salesforce login:
1) If you know the scenario number, just open any scenario and replace the scenario number with the one you want to view.
2) If you don’t remember the scenario number, you the search functionality in Sizer. Search functionality is located on the left of your username (that can be seen at the top left corner). Navigate to the “Advanced” tab in the search dialog and use “Scenario Owner” with the value ‘Created by me’ and you should be able to view the scenario created via Collector Portal.
Yes, when you either export Collector data to Sizer or import Collector data from Sizer, the input CPUs are considered.
Collector reports both raw storage and usable storage. At the cluster level, the storage represents raw cluster storage. Usable storage can indirectly be calculated using the vDisk tab of the XLSX export. There are a couple of caveats around the storage metrics, please refer to other questions under this section.
As of today, Collector gathers storage consumed by snapshots when we take the vCenter/ESXi route. But this data is missing in data gathered via Prism/AHV or Hyper-V. Very soon, we plan to enhance Prism/AHV to gather storage metrics around snapshot.
Unfortunately, as of today, Collector does not report RDM or iSCSI disks. But we do have this in our roadmap.
Nutanix does not compromise on the security of our customers, partners, and prospects. We have comprehensive security measures in place and the same is made available in the security guide available here. Additionally, the security guide is bundled along with Nutanix Collector bits.
Yes, with the launch of Collector 4.0, users do have an option to mask information that might be considered sensitive. This option is available while exporting the data to .XLSX format. We will soon be enabling masking of data even in the Collection file (.zip file).
Hyper-V FAQs
There is a detailed help page on Collector support for Hyper-V, please refer to Collector 3.3 page
At this moment, in the case of Hyper-V, Collector can gather data from only one cluster at a time.
Not yet, it is on the roadmap.
For Collector to gather Guest OS details, NGT needs to be installed and enabled on the guest OS. Collector 3.5.1 is enhanced to pick up guest OS details if the pre-requisites are met.
As of today, Collector gathers data from ESXi hosts is via vCenter APIs and hence we can’t pull data from a standalone ESXi host.
We are currently working on supporting the export of ONTAP output to Sizer. For now, you will have to manually analyze the Collector output and feed it to Sizer. ETA: mid-Jan 2022
The “vDatacenter” sheet within the XLSX can be used to identify the Hypervisor in use. The ‘MOID’ column within the “vDatacenter” maps to the Hypervisor as shown below:
| MOID | Hypervisor |
|---|---|
| Prism Element | AHV |
| Prism Central | AHV |
| Hyper-V | Hyper-V |
| Anything starting with “Datacenter” | ESXi |
The granularity of performance data collection differs based on the hypervisor in use.
Performance data on both, ESXi & AHV, are gathered every 30 minutes. Most metrics are gathered over a period of 7 days.
In the case of Hyper-V, the frequency of performance data collection depends on the duration of data collection initiated. The below table provides a granularity of the data collected:
| Duration of Performance Collection | Frequency of Data Collection | Data points over the duration |
|---|---|---|
| 1 day | 5 minutes | 288 |
| 3 days | 10 minutes | 432 |
| 5 days | 20 minutes | 360 |
| 7 days | 30 minutes | 336 |
Yes, Collector gathers IOPS at cluster level and the throughput – disk usage and network usage at both cluster level as well as host level. The same can also be viewed in the XLSX export of Collector data. In the case of Collector Portal, the VM List tab in the performance view displays the same as well.
The VM Provisioning Status is calculated based on the 95th percentile CPU utilization values. The categorization details can be seen in the tooltip and the same is mentioned below:
Yes, you can customize the VM Provisioning Status criteria using the “Manage” option next to VM Provisioning Status tooltip.
Yes, you can edit the project name. Please refer to the “My Projects” section within the Collector Portal User Guide available here
Collector Portal now allows you to edit multiple VMs in one go via the “Bulk Change” button. Use cases where bulk edits would be of great value:
Sizing a set of VMs in one cluster and the rest in another cluster. For example, all DB VMs “Target Cluster” values can be changed to a new cluster, say DB Cluster instead of default Cluster 1. The rest of the VMs can be left to default, Cluster 1, or further targeted towards specific clusters before exporting to Sizer.
Edit the resources allocated to the set of VMs. For example, all knowledge workers are not allocated enough vCPUs, increase all of them at once via bulk edit.
Unfortunately, not yet but we do plan to export to PDF or PPT in the future.
If you happen to see the below error message:
Invalid input file. Collection Zip file is expected.
One of the possible reasons could be that the original zip file was extracted and zipped once again. Using the original zip file should resolve the issue. If the issue still persists please report the issue.
Please refer to the “Nutanix Collector Compatibility Matrix” section under Collector User Guide available here
Please reach out to us via collector@nutanix.com or reach out to us via slack channel – #collector
Alternatively, our partners, customers, and prospects can also reach out to us via Nutanix Community Page – Sizer Configuration Estimator
Report issues in Nutanix Collector – here
And you can always reach the Product Management @ arun.vijapur@nutanix.com
You have reached the end 🙂 Do let us know if you found this page useful or how we can make this better. Please feel free to share this page with your peers, partners, customers, and even prospects.
Thank you,
Team Nutanix Collector
Nutanix Collector 3.4.1 is the version of Collector which fixes a few critical issues. Along with Collector 3.4.1, there have been continuous updates to Collector Portal as well. The details of the resolved issues are captured below:
RESOLVED ISSUES
Resolved an issue where the collection fails in Hyper-V due to hosts with missing fields.
Resolved an issue with the vCenter collection where the IOPS data is missing.
Resolved an issue in the computation of Median, Average, and the 95th percentile values of the VM Summary Performance Chart.
WHAT’S NEW
vCPU:pCore ratio now available in the VM Summary tab
PORTAL ENHANCEMENTS
Enabled sorting and filtering for all the fields in the VM list tab – both in config view & performance view.
Ability to customize the criteria of VM Provisioning Status
vCPU:pCore ratio now available in the VM Summary tab
For more information please refer to Nutanix Collector 3.4.1 User Guide, Security Guide, Release Notes & Nutanix Collector Portal User Guide
For any other queries related to Nutanix Collector, please refer to Collector FAQs
Public URL: Collector Download Link for Prospects
MyNutanix URL: Collector Download Link for MyNutanix Users
A new donut providing breakup of VMs by Provisioning Status is now available VMs Summary tab.
VM Provisioning Status column is also added to the VM List tab. The column lists the provisioning status of all the VMs.
VM list tab can now be sorted based on the column values along with the filtering capability
Exported XLSX includes an additional sheet for VM List that allows you to look at individual VMs and their attributes.
In the case of vCenter environments, the VM level IOPS values are available.
Improved the column headers in exported XLSX by adding relevant units and renaming a few column names.
Exported XLSX includes a Metadata sheet that captures information relating to the version of the Collector used to capture the data.
The Collector bundle for Windows is now digitally signed to confirm the software author and guarantee that the code has not been altered or corrupted.
AES asymmetric encryption is used for enhanced security while uploading the Collector data to the Collector Portal.
The Collector Security Guide is now included in the Collector download bundle.
Resolved an issue that caused login issues when non-ASCII characters are used in the password.
Resolved the drive capacity and quantity issues in the “Host Summary” screen in the case of Prism environments.
The column header units in the XLSX export are updated from MB to MiB for accuracy.
For more information please refer to Nutanix Collector 3.4 User Guide, Security Guide, Release Notes & Nutanix Collector Portal User Guide.
For any other queries related to Nutanix Collector, please refer to Collector FAQs.
Public URL: Collector Download Link for Prospects
MyNutanix URL: Collector Download Link for MyNutanix Users
Once you have gathered the workload requirements using Collector, you can generate the Nutanix solutions that are best suited for your workload needs by either
Note: Apart from Nutanix Collector, Sizer supports importing output from RVTools and Nutanix Insights. The concepts and parameters remain the same irrespective of the import source.
There are various options while feeding the Collector data to Sizer. This help page will describe how and when to use the different available options.
In the following section, we will be exporting the data from the Collector Portal to Sizer. To export the data to Sizer, navigate to the desired Project in the Collector Portal, click Export, and select the Export to Sizer option as shown in Figure 1 below.

Figure 1: Exporting Collector Project to Sizer
On clicking “Export to Sizer” you will be shown a pop-up dialog asking for Sizer scenario details as seen in Figure 2 below.

Figure 2: Specifying Scenario Details
In the first step, you can specify the Scenario Name and Account name. Optionally, you can specify the Opportunity details are well. The default name of the scenario is the same as the Collector Project name.
Note: Account and Opportunity detail fields are limited to Nutanix Employees and not visible to partners.
In the second step, the user can specify all the “Sizing Preferences” as seen in Figure 3 below

Figure 3: Specifying Sizing Preferences
At a very high level, the sizing preferences are based on the number of VMs and their requirements – the compute, memory & storage.
Now, let’s start with the “VMs” option – Powered ON only vs Both powered ON and powered OFF. Nutanix Collector gathers configuration and performance data of all the VMs managed by the IP address specified while establishing the connection. If there are VMs that you don’t wish to size, you can optionally turn them off using the “VM List” tab before exporting to Sizer. In most scenarios, we recommend the users to choose the “Powered ON only” option but you do have an option to select “Both powered ON and powered OFF” VMs in case you plan to run all the discovered VMs on the Nutanix solution.

Figure 4: Export VMs – Powered ON only vs Both powered ON and powered OFF
Warning: When the data gathered is that of a VDI workload, we highly recommend our users carefully look at the CPU utilization values of the powered-off VMs under the “VM List” tab. The VMs may be powered off when Collector gathered the data but these VMs may have been running intermittently and might be consuming resources. If you miss out on exporting these VMs, you might end up under-sizing the solution.
Next, let us look at the “Capacity” option – Consumed vs Provisioned. This option lets the users decide if they would like to size for storage based on the actual consumed storage or the storage that is provisioned for each VM. The selection purely depends on the actual storage utilization value and the future capacity needs.
Figure 5: Export Storage – Consumed vs Provisioned
If the current environment is over-provisioned on storage, we recommend the users go with the “Consumed” option. Don’t worry about running out of storage if you go by the “Consumed” option, Sizer does take care of it and also ensures the recommended solution is capable of handling node failure. Alternatively, you can always go with the “Provisioned” storage values if you are sure that the allocated storage is required or you want to take a more conservative approach.
Note: When sizing only powered-ON VMs, do ensure to size the storage of powered-OFF VMs. The VMs are powered OFF but the data of powered OFF VMs persists and needs to be accounted for during sizing.
Now, the most critical part, sizing based on Configuration vs Performance. This option will decide the compute or cores within the solution. Again the selection of this option depends on the CPU utilization values. When we look at the data collected, we see a lot of existing solutions are oversized on the compute or cores. This is usually due to the bad job done during requirement gathering or a very conservative approach taken to avoid CSAT issues.

Figure 6: CPU Utilization under Cluster Summary
The cluster summary gives an overall CPU utilization of the cluster and the “Provisioning Status” donut under VMs Summary helps to identify the VMs that are over-provisioned or under-provisioned.

Figure 7: Provisioning Status under VMs Summary
The above two charts should give the users a fair idea and help users to decide on which option to go with when it comes to sizing CPU cores or compute. If the CPU utilization value is very low, we recommend going with “Performance” based sizing. When using the performance-based option, we highly recommend using 95th percentile CPU utilization values to ensure the workload demands are met all the time.

Figure 8: Export Workload CPU options – Configuration vs Performance
Warning: Selecting performance based on Median or Average may result in under-sizing the solution.
When using 95th percentile-based CPU utilization values, Sizer does factor in an additional 20% of compute requirements to ensure the workload spikes are met. The end Sizer solution has enough cores within the solution to ensure you are not short on CPU cores and the solution can handle node failures as per desired resiliency levels (that can be tweaked in Sizer).
The next preference is the “Create Workloads by” option – you can either choose Profile or VM-based workloads. Ever since the launch of “Export to Sizer” we supported “Profile” based workloads. This approach would categorize each collector discovered VM under predefined VM buckets in Sizer – XS, S, M, L, XL.

Figure 9: Export Workload – Profile-based vs VMs based
Beginning in 2021, we have started supporting “per VM” based workloads, this results in a much more accurately defined workload feed to Sizer. We highly recommend the “per VM” based option to our users. This option currently has a limitation and supports only up to 500 VMs. If you are trying to export more than 500 VMs you will have to go with “Profile” based workloads.
Retaining VM to Cluster Mapping is another handy preference – the option is unchecked by default. By default, exporting to Sizer consolidates all the VMs in one cluster (Cluster-1), this is good if the customer wants to consolidate the VMs within one cluster. But if the users want to recreate the same cluster and VM mappings in the Nutanix solution, you can always use “Retain VM to Cluster Mapping” to ensure AS-IS VM to cluster mapping is retained in the Nutanix Sizer solution.
The final option is the Flash percentage – the Flash percentage option allows the user to control the Flash storage requirements.

Figure 10: Specifying workload Flash Requirement
By default, the storage requirements are split into 90:10, 90% HDD requirements, and 10% flash requirements. Depending on the workload nature, the users can tweak this percentage as desired. If the users prefer an all-flash solution, the slider value can be set to 100%.
Now, we are all set to hit the “Done” button to export to Sizer. On successfully exporting to Sizer, you can see the newly created Scenario URL in the banner as shown in Figure 10 below.

Figure 11: Banner showing Sizer Scenario URL
Successful export will also generate a CollectorToolsSummaryReport.xlsx with all the details of the VM data.
Hopefully, this help page provides you with more clarity on the options to choose when exporting Collector data to Sizer. By the way, you will also see the same options when you are trying to “Import” workloads in Sizer either via Collector or RVTools data.
If you have any queries feel free to reach out to Collector Support via collector@nutanix.com or alternatively you reach the Collector team via the Nutanix Community Page – Sizer Configuration Estimator
For more information please refer to Nutanix Collector User Guide, Security Guide, Release Notes & Nutanix Collector Portal User Guide
For any other queries related to Nutanix Collector, please refer to Collector FAQs
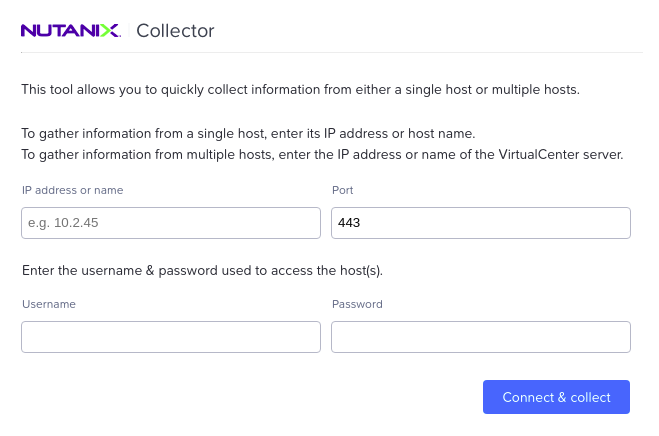
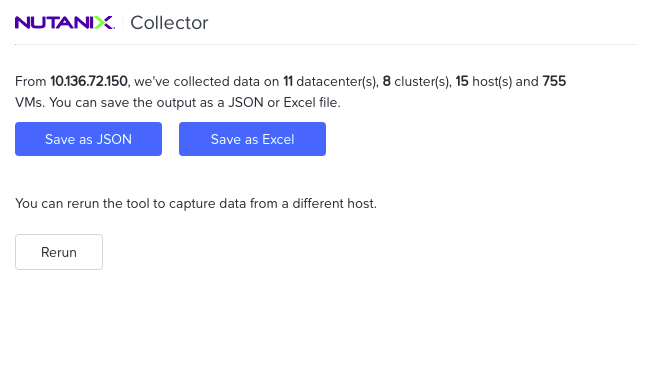
Nutanix Collector collects server virtualization workload details from customers existing datacenters.
Once connected to customer’s hosts or vCenter, the tool collects information such as number of VMs, its power on/off state, VMs configuration which includes number of cores, RAM and allocated and used capacity.
The user gets an option to save the data in excel format.
Currently, as an alternative to RVTools, the Collector output can be imported into Sizer for sizing.
The tool requires host/vCenter IP and user credentials to login and connect (as shown)
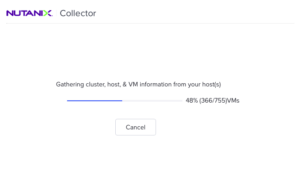
And as it collects the VM data, it shows the status of the data collected
Once the VM information is gathered, it allows the user to save it in excel format
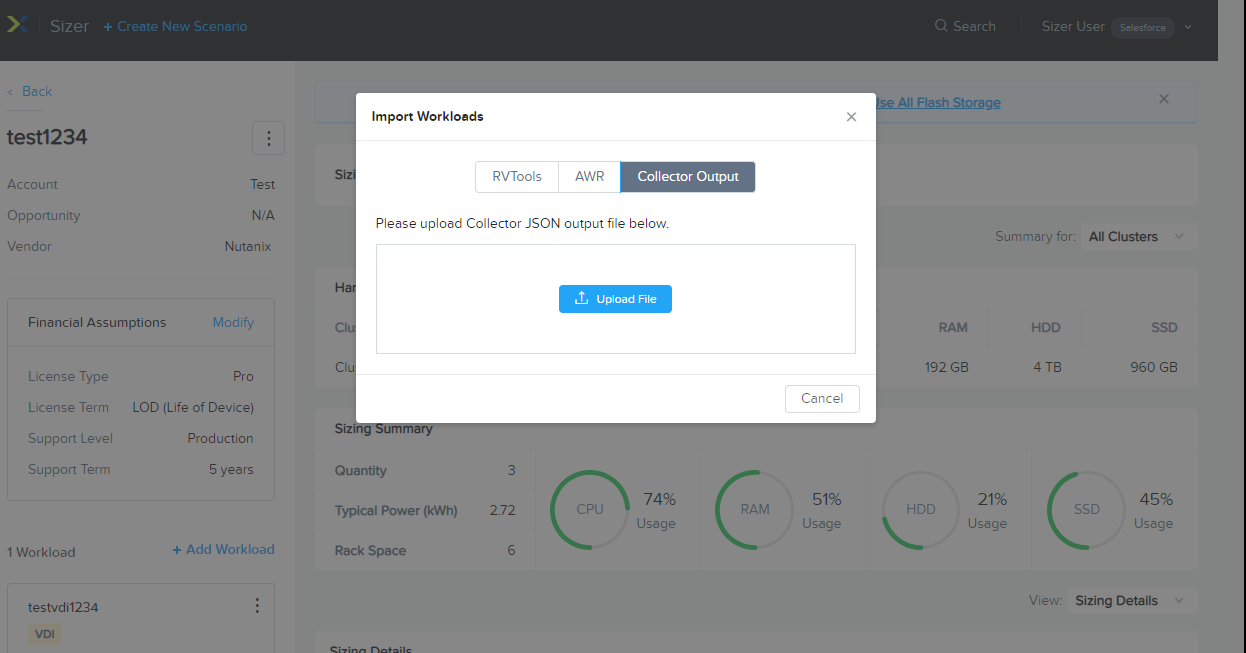
Sizer has an option to import Collector output file..
Does Sizer accounts for all the VMs imported by Collector?
No. Sizer corresponds to only those VMs for which the ‘covered’ column in Collector summary report is ‘Yes’.
There are couple of parameters based on which some VMs might not be covered and Sizer does not size for these VMs.
What are the supported platforms and prerequisites for running the Collector?
How Sizer creates workload using Collector data ?
What are advantages of Collector over RVTools?
Does it work with Sizer ?
Yes, Sizer has an import feature where you can upload Collector output
How does it store the collected data ?
It provides options to save the collected information in Excel format.
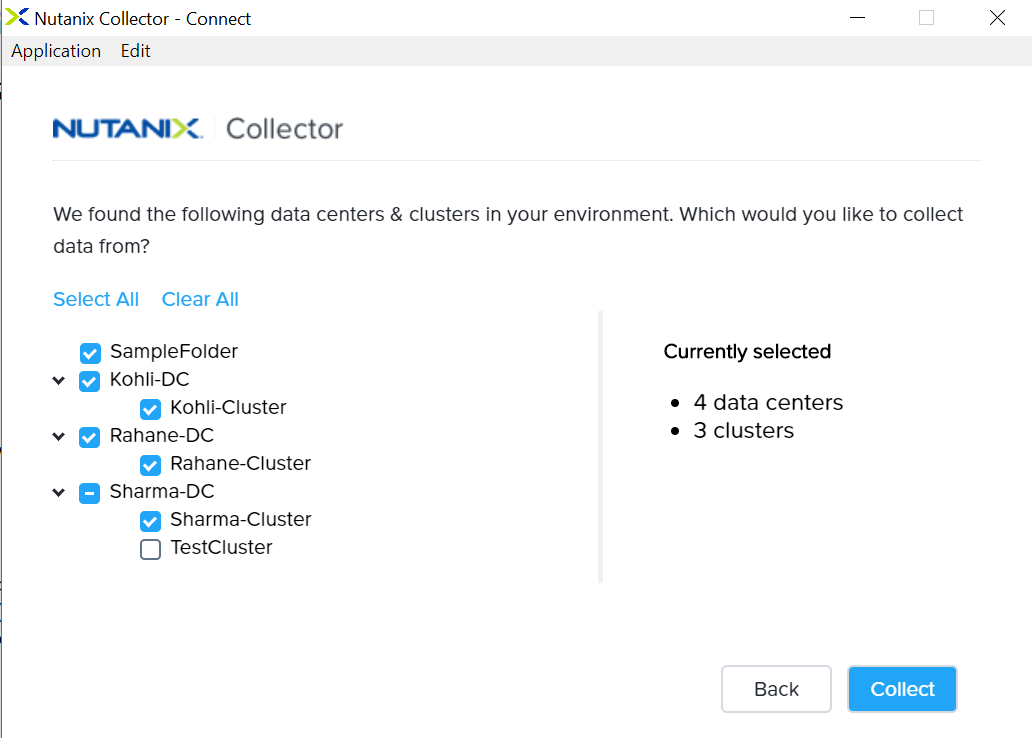
Can we filter on datacenter/cluster which are potential refresh targets for collection?
Yes, with the new Collector , you can select the datacenter/cluster for which you want the VM info collected. This way you can avoid fetching VM info for all the clusters which are part of the vCenter.
Do we have a CLI option ?
Yes, there is a CLI version of Collector for the CLI entusiasts.
Is it available for the customers ?
Currently, it is targetted for our SEs to run it at the customers’ site since today it is a point in time snapshot, however, the later versions are intended to be customer facing.
Here is a short video giving a brief overview and a demo of the tool