Workload Modules Overview

To add a workload simply click on the Add Workload link.    That will pop up  the Add Workload page.

As shown below there are several workload options

  • VDI  – This is a virtual desktop environment for different user profiles
  • Xenapp –  This is a virtual desktop environment for different user profiles.
  • Server Virtualization –  This is for users wanting to deploy web applications
  • SQL Server –  This is for users wanting to deploy SQL Server
  • RAW Input –  This is to simulate other workloads
  • File Services (AFS).  –  This is for customers that want to store files on our infrastructure


  • Once the workload type is selected you can make edits as necessary

One thing that is nice in 3.0, is that all the workload parameters are all on one page.  Thus it is easier to make edits and see all the parameters at once

How to change a profile?


Many of the workloads have profiles like small, medium, large VM or SQL server.  VDI has different user profiles which can be edited

How to define snapshots and Disaster Recover?

If Data Protection is set to Yes than can have following options

  • Local snapshots – here snapshots are kept locally
  • Local and remote snapshots – Here snapshots are in both clusters
  • Disaster Recovery and Local and Remote snapshots –  Here in addition to snapshots we duplicate the resources required to run the workload on the remote cluster to support asynchronous disaster recovery.


If either Remote snapshots or Disaster Recovery is expected then a Remote Cluster needs to be specified.  Also Sizer needs to know the snapshot frequency in minutes, amount of change expected within a snapshot period, and number of snapshots retained.  Same policy is applied to local and remote snapshots.

Scenario Page Overview

Though it looks like a complicated page it is organized neatly into different parts.  Looking  from upper right and going clockwise

  • Sizing Options –  This shows current specification on how you want Sizer to do a sizing like Automatic with All Flash, Manual, etc.
  • Hardware summary.  Shows the model that was recommended.  Mulntiple rows cover mixed clusters with different types of nodes.
  • Sizing Summary.  This shows the current results for the recommendation.  The dials show the utilization for cpu, RAM, HDD, SSD for all clusters combined.    Later Sizer will allow for a per-cluster view
  • Sizing Details.  Here all the workloads are summarized and the total required resources are summed for all the workloads.   In the larger table the recommendation’s sizing details are shown in terms of cpu, ram, hdd, ssd usage to cover the workloads, RF2, CVM, etc
  • Workloads.  In the left panel are the list of workloads in the scenario
  • Actions button.  Here various actions can be performed on the scenario such as downloading a BOM.

Sizing Details

Sizing Detail Video

Sizing Details:

First of all you can look at Sizing Details for each cluster or All clusters.

In the top part are the resource requirements  (Cores, RAM, HDD, SSD) from one or more workloads.  These numbers are computed by the workload modules.  Here we have a couple workloads and the resources are totaled under Total

The bottom section is the Capacity calculations for the recommendation.

  • The Raw Capacity row is the total available resources (cores, RAM, HDD, SSD) in the cluster(s).    A few things need to be explained
    • Cores is adjusted by specint weight and if there are memory issues like unbalanced DIMMS
      • here is the tooltip which shows the adjustment.  There are total of 72 physical cores in the recommendation.  This is number of models * number of cpu’s per model  * number of cores per cpu
      • Sizer needs to adjust different core speeds as they can vary widely and SpecINt2006 is the standard used.  Here it is -2.23 vs baseline processor.    More information on how Applied Weight is calculated here Sizing Approaches and Logic
      • Sizer does test for unbalanced dimms and here there is no issue and so adjustment = 0.  More information on how Unbalanced DIMMs is accounted for is here Sizing Approaches and Logic

  • So for Sizer in this example it assumes there are 69.77 “baseline” cores.
  • RAM –  Here Sizer computes total RAM and converts it to TiB.
    • Here there are 3 nodes and each node has 32GB x 8 Dimms for a total of 768GB of RAM in the recommendation
    • A note of trivia, RAM is sold as GB but in reality is GiB.  Since 32GB is less than 32 GiB there is no issue in marketing them in GB as customer is getting more than they expected.  Sizer is very exact though and so we acknowledge its full potential of 32 GiB per DIMM and so here there are 768 GiB in the recommendation
    • Converting to TiB it is 768 GiB/1024 = 0.75 TiB  ( there are 1024 GiB in 1 TiB, while 1000 GB in  1 TB)
  • HDD   Here Sizer computes total HDD and converts it to TiB.
    • Here there are 3 nodes and each node has 4x2TB drives  for a total of 24TB of HDD in the recommendation
    • Converting to TiB it is 24TB * 0.909494702 TiB/TB = 21.83 TiB
  • SSD   Here Sizer computes total SSD and converts it to TiB.
    • Here there are 3 nodes and each node has 2x960GB drives  for a total of 5760GB of SSD in the recommendation
    • We do allocate space for downstroking (80GB per drive) for regular SSDs but no downstroking if Encrypted drives
    • so here need to discount downstroking for 6 drives or 480GB.  Now the net is 5760 GB – 480 GB = 5280 GB.  This is 5.28 TB as there are 1000 GB per TB.
    • Converting to TiB it is 5.28TB   * 0.909494702 TiB/TB = 4.80 TiB
  • Compression Savings is the total amount of compression savings found in the workload modules.
  • Dedupe Savings and ECX Savings (none in this example) are found in the workload modules
  • RF Overhead is the total amount of HDD or SSD needed to meet the RF2 or RF3 requirements that were set in the workload modules.

  • CVM overhead is calculated by Sizer following latest rules.    See the next section.  Also  more information on how CVM Sizing is here Sizing Approaches and Logic
  • Workload total is the same numbers from workload section

  • Usable Remaining Capacity (Assuming RF2)
    • HDD Usable Remaining  Capacity = (Raw + Compression Savings + Dedupe Savings + ECX Savings – RF Overhead – CVM overhead ) / 2
    • SSD Usable Remaining  Capacity =  (Raw + Compression Savings + Dedupe Savings + ECX Savings – RF Overhead – CVM overhead + Oplog ) / 2
    • Notes:
      • If All Flash,  Compression Savings, Dedupe Savings , ECX Savings, RF Overhead,  and CVM overhead that would be attributed to HDD’s is applied to SSDs
      • For SSD Capacity,Oplog is included as part of CVM overhead for SSDs but also added back into Usable capacity as it is a Write log and so is available for user data.


  • Usable Remaining Capacity (Assuming RF3)
    • HDD Usable Remaining  Capacity = (Raw + Compression Savings + Dedupe Savings + ECX Savings – RF Overhead – CVM overhead ) / 3
    • SSD Usable Remaining  Capacity =  (Raw + Compression Savings + Dedupe Savings + ECX Savings – RF Overhead – CVM overhead + Oplog ) / 3
    • Notes:
      • If All Flash,  Compression Savings, Dedupe Savings , ECX Savings, RF Overhead,  and CVM overhead that would be attributed to HDD’s is applied to SSDs
      • For SSD capacity, Oplog is included as part of CVM overhead for SSDs but also added back into Usable capacity  as it is a Write log and so is available for user data.
  • Extent Store (Assuming RF2)

    • As the tooltip indicates Extent Store is RAW less CVM.  It represents the amount of storage left after CVM .  Put another way it is amount storage available to the customer  before workloads are added.   Here workloads are not included.   The workload RF copies are not included.  Storage efficiencies such as compression or dedupe is not included.   Extent store is a concept in the Nutanix Bible.
    • HDD Extent Store (Assuming RF2) = (RAW – CVM)/2 = (21.83 – 2.63)/2 = 9.6 TiB
    • SSD Extent Store (Assuming RF2) = (RAW – CVM)/2 = (4.8 – 2.03)/2 =  1.38 TiB
  • Extent Store (Assuming RF3)

  • As the tooltip indicates Extent Store is RAW less CVM.  It represents the amount of storage left after CVM .  Put another way it is amount storage available to the customer  before workloads are added.   Here workloads are not included.   The workload RF copies are not included.  Storage efficiencies such as compression or dedupe is not included.   Extent store is a concept in the Nutanix Bible.
  • HDD Extent Store (Assuming RF3) = (RAW – CVM)/2 = (21.83 – 2.63)/3 =  6.4 TiB
  • SSD Extent Store (Assuming RF3) = (RAW – CVM)/3 = (4.8 – 2.03)/3 =  0.92 TiB
  •  

    • What are the details on CVM overheads?

      • HDD numbers can be seen by clicking the “I” button
      • SSD numbers can be seen by clicking the “I” button
      • In case of AF all the CVM components are applied to SSD CVM
      • In this example here is the HDD

    • In this example here is the SSD

    Refer to Sizing Approaches and Logic for information on how these numbers are calculated

    Sizing Charts

    The point of Sizing Charts is simply to give exact presentation of the Sizing Details in charts.  Any value in Sizing Charts is reflected in Sizing Details.  Sizing Details being thorough is frankly a table with a lot of numbers.  Sizing Charts then puts it in nice charts if user wants to see it.  Also good to capture in proposals

    Separate is Storage Calculator which allows you to enter your own set of nodes and see extent store and a derived effective capacity.  That is NOT tied to the scenario in terms of workloads, recommendation, sizing details.  More info on different page.

    Here is the Sizing Details for a Scenario

    This is sample scenario that is used to describe the charts.

    Here is the Sizing Charts for this scenario

    There is an option to view all charts at once.  You can see there is a 1:1 coorespondance between the Sizing Details and the charts for Cores, Ram, HDD, and SSD.  Also shown is the breakout for SSD CVM and HDD CVM.  Maybe a technical customer wants to see the details but in graphical form and this would cover it

    Each of these can be looked at individually so you can just look at what interests you

    Cores

    Here you see the sizing elements for Core.  The tooltip shows the applied weight adjustment and memory adjustments.  The donut shows the CVM, workload requirement and usable remaining cores.

    RAM


    This is the RAM chart.  In this scenario there is 17 TiB of RAM available.  CVM consumes 1 TiB, workload consumes 14.45 TiB and 2.04 TiB remaining

    HDD

    This shows HDD.  The total amount of HDD space is RAW plus storage efficiency which in this case is just compression.  Dedupe of ECX are two other technologies that save space.   So because of compression savings we actually can deal with a total of 418.49 TiB.  That number is the size of the donut chart.  From there things that consume space would be the workload, RF overhead, and CVM.  Usable remaining HDD then is 122.59 TiB.  In sizing details it is reported as Usable remaining capacity  (Assuming RF2) = 122.59/2 = 61.3 or Usable remaining capacity  (Assuming RF3) = 122.59/3 = 40.86

    SSD

    This shows SSD.  The total amount of SSD space is RAW plus storage efficiency which in this case is just compression.  Dedupe of ECX are two other technologies that save space.    For SSD (as explained in Sizing details) we do also add back oplog because being a write journal it is user space.  So because of compression savings  and adding back oplog we actually can deal with a total of 302.06 TiB.  That number is the size of the donut chart.  From there things that consume space would be the workload, RF overhead, and CVM.  Usable remaining HDD then is 31.34 TiB.  In sizing details it is reported as Usable remaining capacity  (Assuming RF2) = 31.34/2 = 15.67 or Usable remaining capacity  (Assuming RF3) = 31.34/3 = 10.45

    HDD CVM

    There is a chart that shows the CVM components on HDD.  In case of All Flash solution all CVM components are stored in SSD

    SSD CVM

    There is a chart that shows the CVM components on SSD.  In case of All Flash solution all CVM components are stored in SSD.

    Questions

    What is purpose of Storage Charts?   –  Simply to give a graphical picture of the numbers in Sizing Details.  Here you can see Cores, RAM, HDD, SSD that is consumed and what is available for RF2 or RF3.  It is tied to the scenario.  Thus changing workloads or models will change the charts

    What is purpose of Storage Calculator?   –  It is separate from the scenario in terms of workloads and recommendations.  It is intended to allow user to scope amount of storage that is available for given set of nodes.  It answers what is the potential storage available for those nodes.

    Do I need the Storage Charts?  –  Since it is 100% duplicate of Sizing Details, not necessarily.  It does give a graphical view though

    Sizing Summary

    Well the dials of course.  In our user focus groups everyone loved the dials and yep we kept them.  On left is the node count, power, and rack space.


    What are the thresholds?

    Just hover your mouse over CPU, RAM, HDD ,or SSD and can see it.    However, it is 95% for CPU and RAM, 90% for HDD and 98% for SSD.

    re the dials set for N+1?

    Depends!!   The dials show the utilization for what you configure the sizing for.  So in auto, there is aggressive  (n+0) , standard  (n+1), conservative (n+2).  In manual,  you are in the driver seat and define the models (ok can only have legitimate parts for that model).  So in manual the dials show you what utilization is available for the models you defined.


    Cluster Views

    Sizer supports multiple clusters.  Each workload can be assigned to any cluster.  Then in the recommendation you can view results for All Clusters or separately on a cluster by cluster basis

    Here is recommendation for All Clusters,  All the hardware and all the workloads are combined in one view.


    The Sizing Details also reflect the sizing information for all the clusters combined.

    Here is same recommendation but for just one cluster.  Note just the  hardware and the workloads assigned to that cluster is in the view.


    The Sizing Details reflect the sizing information just for that cluster.

    Alternatively can look at Rack View for All Clusters or on a cluster by cluster basis

    Likewise can view Sizing Charts for All Clusters or on a cluster by cluster basis

    Hardware summary

    Hardware summary shows the model(s) definition of the recommendation.  In a mixed cluster it may have a couple lines for different models.  It also tells you what cluster the models are assigned to.

    Ok show me something really cool that I’ll LOVE in Hardware Summary compared to Sizer 2.1?

    Click on the “I” and you get the model details and so you DO NOT HAVE to go to MANUAL just to see the model bom  !!!    Ok maybe I’m a nerd but I love it ?


    What do the letters in the SSD drive indicate?

    The letters indicate different levels of endurance in terms of Drive Writes per Day (DWPD).  For example, 3DWPD means you can rewrite all the data on the drive 3 times a day for its entire life that it is warranted for.

    Do we support hybrid on non Nutanix models?

    Definitely, we support all flash as well as hybrid on all vendors including Lenovo, HPE, Cisco,Dell XC, Dell PE among others..

    The Hardware Compatability List [HCL] mentions the hybrid and all flash combinations supported for the different vendors.

    Is Sizer aligned with Hardware Compatability List(HCL) for hardware configurations ?

    Yes, Sizer, at all times is in sync with HCL on the valid configurtions for across all HW vendors.  At times, certain rules that Sizer implements is mentioned as a note in HCL , so it is advisable to go through the HCL notes to avoid confusion. 

    For ex:  In Sizer, for HPE DL380 Gen10 14LFF, using SFF SSD will show invalid configuration unless used in the rear of the server. The same is mentioned in the HPE HCL as a note in the SSD configuration section.  Therefore, faced with any such situation where Sizer shows as invalid configuration, it is advisable to look through HCL notes for clarification. 

    Automatic and Manual Sizing Options

    On the main scenario page you see the Sizing specification.  Here it is

    • Buy
    • Homogeneous – All the nodes in the recommendation are IDENTICAL
    • Standard Failover
    • Any storage is allowed (Hybrid or All Flash)

    Automatic Sizing Options

    Here you see the current Automatic sizing options

    • Buy vs Rent.  For Nutanix there are a few bundles that can be rented.  Default is Buy and most users will leave it there
    • Homogeneous vs Mixed – In Homogeneous, all the nodes in the recommendation are IDENTICAL.  This means totally same model with same CPU, RAM, HDD, SSD, NIC.  A mixed cluster allows Sizer to look at second model to come to optimal solution
    • Failover
      • Aggressive is N+0.  Sizer finds lowest cost recommendation that meets the workload requirements but does NOT assure N+1 where a node can be taken down (example during upgrade) or lost
      • Standard is N+1.  Sizer finds lowest cost recommendation that meets the workload requirements and adds a node to assure N+1 where a node can be taken down (example during upgrade) or lost
      • Conservative is N+2.  Sizer finds lowest cost recommendation that meets the workload requirements and adds two nodes to assure N+2 where two node can be lost.
      • RECOMMENDATION:  Stay with Standard.  Aggressive might be good for PoC but not in production.  A key value proposition of Nutanix is online upgrades which N+1 allows.  Few users go to Conservative given extra cost of 2 spare nodes
      • Storage
        • Any storage is allowed (Hybrid or All Flash)

    All Flash –  Here Sizer will limit recommendations to just All flash models


    Model Filter

    With the model filter can tell Sizer just find the optimal solution for the models you want to focus on.  Say for example your customer has standardized on the NX-3060-G5.  Just click on that model only as shown above and you know Sizer will only look at those models.


    Manual Sizing options

    • You can specify Buy or Rent models.
    • On right can add a model or shown below edit a model

    Collector

    Nutanix Collector collects server virtualization workload details from customers existing datacenters.

    Once connected to customer’s hosts or vCenter, the tool collects information such as number of VMs, its power on/off state, VMs configuration which includes number of cores, RAM and allocated and used capacity.

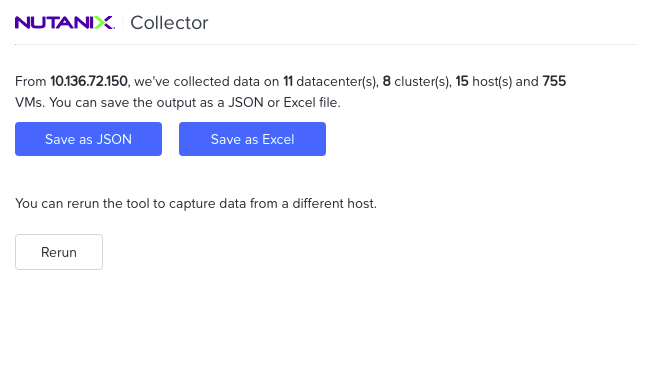
    The user gets an option to save the data in excel format.

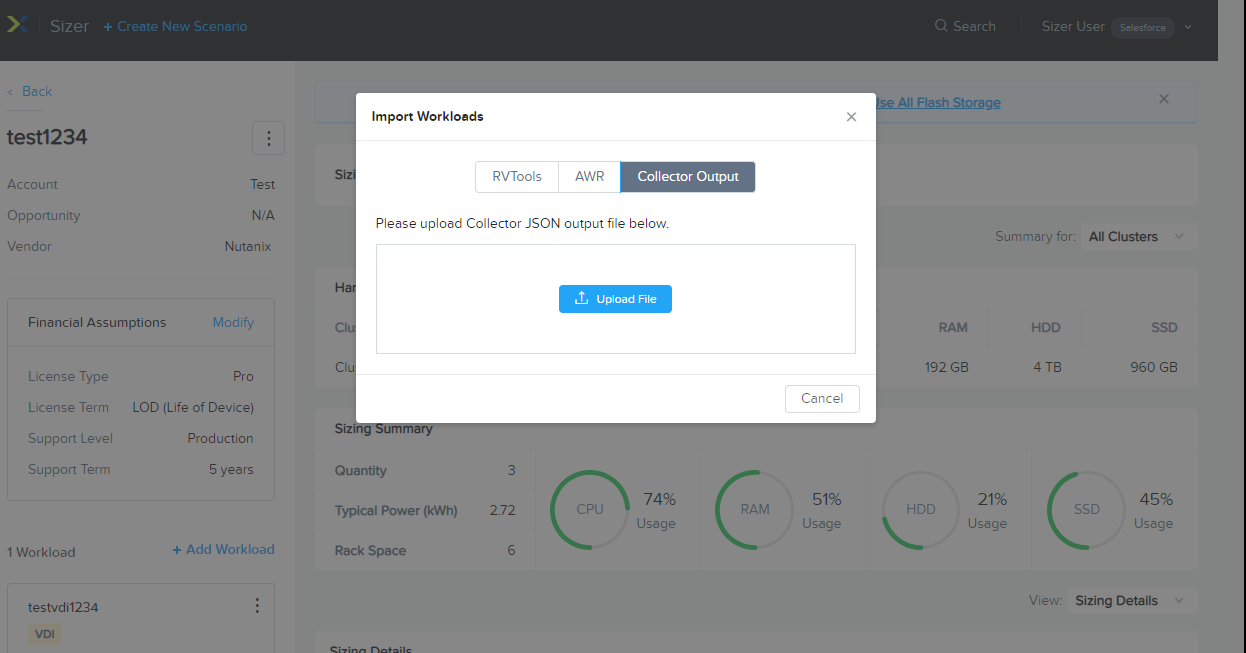
    Currently, as an alternative to RVTools, the Collector output can be imported into Sizer for sizing.

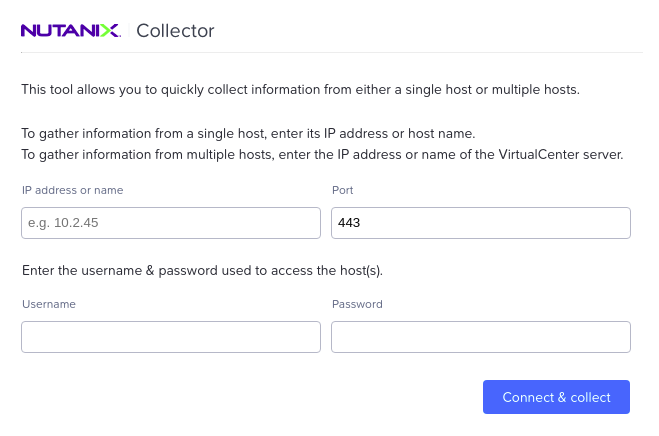
    The tool requires host/vCenter IP and user credentials to login and connect (as shown)
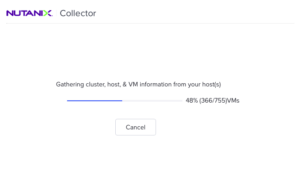
    And as it collects the VM data, it shows the status of the data collected
    Once the VM information is gathered, it allows the user to save it in excel  format
    Sizer has an option to import Collector output file..
    Steps for using Collector in Sizer


    • The NTNX SE or Partner SE  to install the Collector on their laptop.
      • If SE runs it on their laptop, they would need permission and cooperation with the customer to have it point to VCenter or ESX. User/password is needed and must not be blocked by a firewall.
      • If customer gives final excel output, SE still needs customer to agree that configuration can be shared.
    • Once the SE has the Excel output, they will import it into Sizer which will group most of the  VMs into one of 25 profiles.
    • Sizer will then return an excel with a Sizer_summary tab which has key information but also what profile is applied or “not covered”
    • The user should review this with the customer and especially those not covered by a profile.  They are very high in either CPU or RAM or Total capacity. Do they need to be that high? If so the user would create custom workload.


    Does Sizer accounts for all the VMs imported by Collector?

    No. Sizer corresponds to only those VMs for which the ‘covered’ column in Collector summary report is ‘Yes’.

    There are couple of parameters based on which some VMs might not be covered and Sizer does not size for these VMs.

    Powerstate flag

    • A customer may have many VMs and often some are defined but turned off are actually dormant.  Automatically sizing all VMs could cause Sizer to oversize the environment. Conversely, some of the VMs that are powered down may be applications that are used occasionally and need to be sized.
    • We use the powerstate flag.  SE should discuss with customer. If they feel it will be migrated but was off when the tool was run they should change flag to poweredOn.
    • Conversely changing that flag to poweredOff will tell Sizer to not size it

     Workload profiles

    • From vParition sheet in Collector , we read two columns – Capacity MB and Consumed MB .
    • Calculate total of Capactity MB and total Consumed MB for any VM as a VM can have multiple partitions.
    • If the VM is thick provisioned, we consider Capacity MB, if thin provisioned, Consumed MB is used for calculation.
    • Then we do Groupings of VM based on CPU and RAM (example Small CPU and Small RAM).
    • Storage capacity requirement for the group (Small CPU and Small RAM) is calculated as the average of the total capacity of the VMs that are part of the group
      • Use Capacity MB for thick provisoned VM and Consumed MB for thin provisioned VM for the calculations.
    • Sizer will try to group the VMs into one of 25 workload profiles.  If the VM has simply higher capacity, CPU, RAM requirements than any of the profiles, then Sizer will flag that for user review.  The user can either assume it was over-provisioned and go with one of the profiles or create a custom workload for that larger VM

    What are the supported platforms and prerequisites for running the Collector? 

    • It has Windows, Mac and Linus versions as well as CLI. It requires network connectivity to the cluster that is being analyzed.  It would need vCenter userid and password to connect to the cluster.

    How Sizer creates workload using Collector data ?

    • User will  import the Collector Excel into Sizer.  There is a upload file button on Import Workloads page.
    • Sizer will pull all the info for each poweredOn VM
    • Sizer will see if the VM fits one of the 25 profiles. It will try to fit the VM in the smallest one that still fits.
    • Sizer will then create an excel sheet with the sizer_summary tab.  It has all the info Sizer grabbed info and state the profile that was selected or “not covered”


    What are advantages of Collector over RVTools?

    • Currenttly, Collector is an alternative to RVTools providing allocated resources information about the VMs and integrated into Sizer without worrying about version issues.Going forward, Collector will have lot more information on the VMs usage pattern such as utilization rate of the resources namely core,RAM,capacity over time which can range from a day to a week or a months’ worth of data.  There are other metrics that will be captured such as IOPS , IO size , latency which will go a long way in sizing the cluster more effectively.

    Does it work with Sizer ?

    Yes, Sizer has an import feature where you can upload Collector output

    How does it store the collected data ?

    It provides options to save the collected information in Excel format.

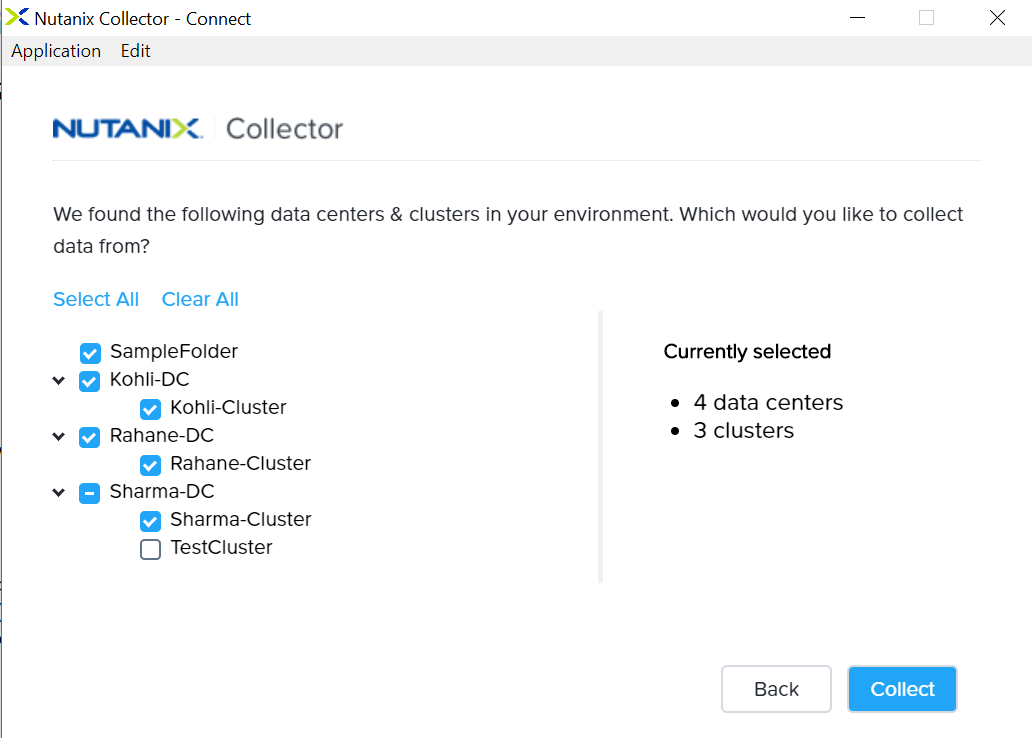
    Can we filter on datacenter/cluster which are potential refresh targets for collection? 

    Yes, with the new Collector  , you can select the datacenter/cluster for which you want the VM info collected. This way you can avoid fetching VM info for all the clusters which are part of the vCenter.
    Do we have a CLI option ?

    Yes, there is a CLI version of Collector for the CLI entusiasts.

    Is it available for the customers ?

    Currently, it is targetted for our SEs to run it at the customers’ site since today it is a point in time snapshot, however, the later versions are intended to be customer facing.

    Here is a short video giving a brief overview and a demo of the tool


    RVTool Import into Sizer

    RVTools overview

    RVtools is a leading tool to monitor VMware clusters.  It is an free tool, that runs on Windows (.Net 4 application), can query VMWare’s  VI (Virtual Infrastructure) API to get numerous attributes. The VI API is exposed as a Web service, running on both ESX Server and VirtualCenter Server systems.

    As you can see from the screenshot below, the tool has a number of tabs capturing the details in tabular format.

    Steps for using RVTool in Sizer


    • The NTNX SE or Partner SE  to install the supported version of RVtools from Robware on their laptop.  Alternatively, the customer often has it installed and gives the SE the final excel file.
      • If SE runs it on their laptop, they would need permission and cooperation with the customer to have it point to VCenter or ESX. User/password is needed and must not be blocked by a firewall.   This can be a big issue and so could be best to have the customer running RVtools.
      • If customer gives final excel output, SE still needs customer to agree that configuration can be shared.
      • The command line to run the tool and create the excel output is included in this document.
    • Once the SE has the Excel output, they will import it into Sizer which will group most of the  VMs into one of 25 profiles.
    • Sizer will then return an excel with a Sizer_summary tab which has key information but also what profile is applied or “not covered”
    • The user should review this with the customer and especially those not covered by a profile.  They are very high in either CPU or RAM or Total capacity. Do they need to be that high? If so the user would create custom workload.

    Does Sizer accounts for all the VMs imported by RVTool?

    No. Sizer corresponds to only those VMs for which the ‘covered’ column in RVTool summary report is ‘Yes’.

    There are couple of parameters based on which some VMs might not be covered and Sizer does not size for these VMs.

            Powerstate flag

    • A customer may have many VMs and often some are defined but turned off are actually dormant.  Automatically sizing all VMs could cause Sizer to oversize the environment. Conversely, some of the VMs that are powered down may be applications that are used occasionally and need to be sized.
    • We use the powerstate flag.  SE should discuss with customer. If they feel it will be migrated but was off when the tool was run they should change flag to poweredOn.
    • Conversely changing that flag to poweredOff will tell Sizer to not size it

           Workload profiles

    • From vParition sheet in RV tools , we read two columns – Capacity MB and Consumed MB .
    • Calculate total of Capactity MB and total Consumed MB for any VM as a VM can have multiple partitions.
    • If the VM is thick provisioned, we consider Capacity MB, if thin provisioned, Consumed MB is used for calculation.
    • Then we do Groupings of VM based on CPU and RAM (example Small CPU and Small RAM).
    • Storage capacity requirement for the group (Small CPU and Small RAM) is calculated as the average of the total capacity of the VMs that are part of the group
      • Use Capacity MB for thick provisoned VM and Consumed MB for thin provisioned VM for the calculations.
    • Sizer will try to group the VMs into one of 25 workload profiles.  If the VM has simply higher capacity, CPU, RAM requirements than any of the profiles, then Sizer will flag that for user review.  The user can either assume it was over-provisioned and go with one of the profiles or create a custom workload for that larger VM.

    How are the usable capacities determined for VMs?

    From Vparition sheet in RV tools , we read two columns – Capacity MB and Consumed MB.

    Finding capacity for Sizing: 

    • If Thin = True, then we use Consumed for Final Capacity
    • If Thin =False, then we go with Capacity for Final Capacity
    • (Note: Thin variable comes from vDisk tab)
    • We group VMs into categories such as Small CPU, Small RAM
    • We create a list of VMs for those that are Thin and those that are thick provisioned.  So we can have Small CPU and Small RAM that are thin provisioned and those that are thick provisioned.  
    • In each group in each list we then go with the max cap value of all those VMs and apply 90% HDD and 10% SSD

    What are the prerequisites for running the RVTool? 

    Its a windows application running on a desktop or laptop with network connectivity to the cluster that is being analyzed.  It would need vCenter userid and password to connect to the cluster.

    How Sizer creates workload using RVTools data ?


    1. User will  import the RVtools excel into Sizer.  There is a upload file button on Import Workloads page.
    2. Sizer will pull all the info for each poweredOn VM
    3. Sizer will see if the VM fits one of the 25 profiles. It will try to fit the VM in the smallest one that still fits.
    4. Sizer will then create an excel sheet with the sizer_summary tab.  It has all the info Sizer grabbed info and state the profile that was selected or “not covered”

    What does CPUs column mean in the RVTool sumary sheet ?
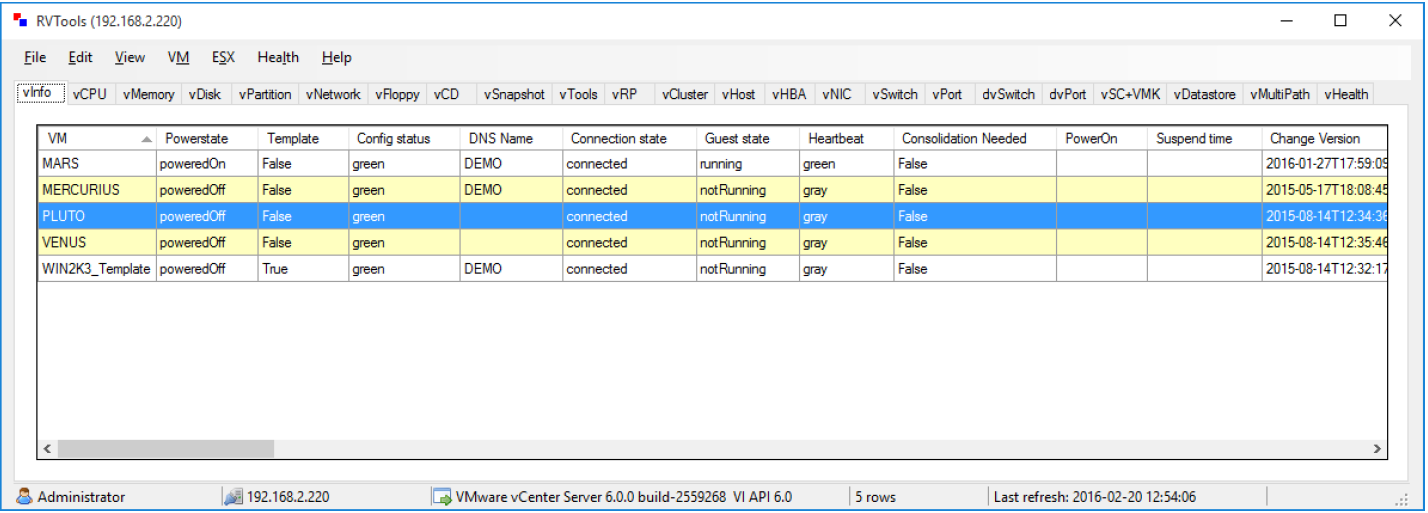
    The values for the CPUs column in the Sizer summary sheet  indicate the CPU profile for the VM.

    As explained above, every VM is classified as small, medium , large etc as per the vCPU count of the VM as below:

    VCPU

    • Small = 1
    • Medium = 2
    • Large = 4
    • X-Large = 8
    • XX-Large = 16

    On what basis is the VM  vCPU and vMemory classified ?

    Below is the classification criteria for VM vCPU and memory

    VCPU

    • Small <= 1
    • Medium <= 2
    • Large <= 4
    • X-Large <= 8
    • XX-Large <= 16

    RAM

    • Small = <1.024GB
    • Medium <2.048 GB
    • Large <8.2 GB
    • X-Large <16GB
    • XX-Large <32 GB


    What does Cores column mean in the RVTool sumary sheet ?
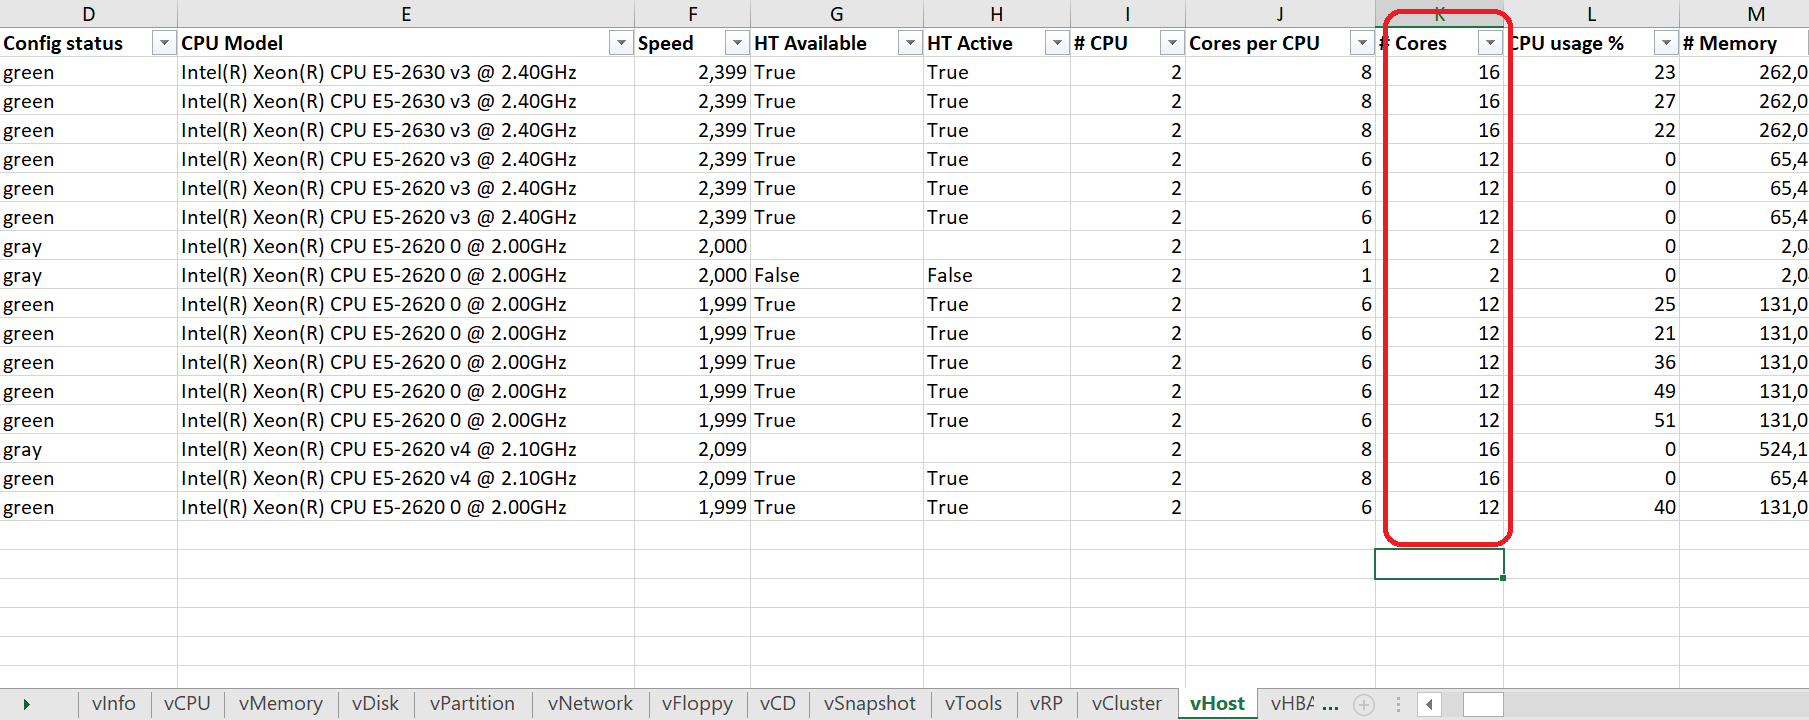
    These indicate the total number of cores available in the host machine of the VM. These are collected in the vHost tab of the RVTool export.

    What happens to the VMs which are not covered as it does not fit in one of the 25 server virtualization profiles?

    Analysis has shown about 85% of the VMs fit in these 15 server virtualization profiles. For a handful of VMs that does ont fit in the profile, SEs can review the VMs with the customer. Often some VMs are over provisioned and would fit in one of the profiles.

    These changes need to be made manually to the RVTool excel and imported to Sizer for a revised sizing summary.

    How do I handle errors associated with importing RV tools?
    Make sure you used the latest version of RVTools and that the output has not been tempered with. Also, make sure you have read/write rights on the file before uploading.