Sizing Summary

Well the dials of course.  In our user focus groups everyone loved the dials and yep we kept them.  On left is the node count, power, and rack space.


What are the thresholds?

Just hover your mouse over CPU, RAM, HDD ,or SSD and can see it.    However, it is 95% for CPU and RAM, 90% for HDD and 98% for SSD.

re the dials set for N+1?

Depends!!   The dials show the utilization for what you configure the sizing for.  So in auto, there is aggressive  (n+0) , standard  (n+1), conservative (n+2).  In manual,  you are in the driver seat and define the models (ok can only have legitimate parts for that model).  So in manual the dials show you what utilization is available for the models you defined.


Cluster Views

Sizer supports multiple clusters.  Each workload can be assigned to any cluster.  Then in the recommendation you can view results for All Clusters or separately on a cluster by cluster basis

Here is recommendation for All Clusters,  All the hardware and all the workloads are combined in one view.


The Sizing Details also reflect the sizing information for all the clusters combined.

Here is same recommendation but for just one cluster.  Note just the  hardware and the workloads assigned to that cluster is in the view.


The Sizing Details reflect the sizing information just for that cluster.

Alternatively can look at Rack View for All Clusters or on a cluster by cluster basis

Likewise can view Sizing Charts for All Clusters or on a cluster by cluster basis

Hardware summary

Hardware summary shows the model(s) definition of the recommendation.  In a mixed cluster it may have a couple lines for different models.  It also tells you what cluster the models are assigned to.

Ok show me something really cool that I’ll LOVE in Hardware Summary compared to Sizer 2.1?

Click on the “I” and you get the model details and so you DO NOT HAVE to go to MANUAL just to see the model bom  !!!    Ok maybe I’m a nerd but I love it ?


What do the letters in the SSD drive indicate?

The letters indicate different levels of endurance in terms of Drive Writes per Day (DWPD).  For example, 3DWPD means you can rewrite all the data on the drive 3 times a day for its entire life that it is warranted for.

Do we support hybrid on non Nutanix models?

Definitely, we support all flash as well as hybrid on all vendors including Lenovo, HPE, Cisco,Dell XC, Dell PE among others..

The Hardware Compatability List [HCL] mentions the hybrid and all flash combinations supported for the different vendors.

Is Sizer aligned with Hardware Compatability List(HCL) for hardware configurations ?

Yes, Sizer, at all times is in sync with HCL on the valid configurtions for across all HW vendors.  At times, certain rules that Sizer implements is mentioned as a note in HCL , so it is advisable to go through the HCL notes to avoid confusion. 

For ex:  In Sizer, for HPE DL380 Gen10 14LFF, using SFF SSD will show invalid configuration unless used in the rear of the server. The same is mentioned in the HPE HCL as a note in the SSD configuration section.  Therefore, faced with any such situation where Sizer shows as invalid configuration, it is advisable to look through HCL notes for clarification. 

Automatic and Manual Sizing Options

On the main scenario page you see the Sizing specification.  Here it is

  • Buy
  • Homogeneous – All the nodes in the recommendation are IDENTICAL
  • Standard Failover
  • Any storage is allowed (Hybrid or All Flash)

Automatic Sizing Options

Here you see the current Automatic sizing options

  • Buy vs Rent.  For Nutanix there are a few bundles that can be rented.  Default is Buy and most users will leave it there
  • Homogeneous vs Mixed – In Homogeneous, all the nodes in the recommendation are IDENTICAL.  This means totally same model with same CPU, RAM, HDD, SSD, NIC.  A mixed cluster allows Sizer to look at second model to come to optimal solution
  • Failover
    • Aggressive is N+0.  Sizer finds lowest cost recommendation that meets the workload requirements but does NOT assure N+1 where a node can be taken down (example during upgrade) or lost
    • Standard is N+1.  Sizer finds lowest cost recommendation that meets the workload requirements and adds a node to assure N+1 where a node can be taken down (example during upgrade) or lost
    • Conservative is N+2.  Sizer finds lowest cost recommendation that meets the workload requirements and adds two nodes to assure N+2 where two node can be lost.
    • RECOMMENDATION:  Stay with Standard.  Aggressive might be good for PoC but not in production.  A key value proposition of Nutanix is online upgrades which N+1 allows.  Few users go to Conservative given extra cost of 2 spare nodes
    • Storage
      • Any storage is allowed (Hybrid or All Flash)

All Flash –  Here Sizer will limit recommendations to just All flash models


Model Filter

With the model filter can tell Sizer just find the optimal solution for the models you want to focus on.  Say for example your customer has standardized on the NX-3060-G5.  Just click on that model only as shown above and you know Sizer will only look at those models.


Manual Sizing options

  • You can specify Buy or Rent models.
  • On right can add a model or shown below edit a model

Super Auto Sizing

We have greatly enhanced our Automatic Sizing.  Auto goes through all the possible options (an option is a model with specific component combination) and finds the optimal solution (lowest net cost)

Certainly good to know and often is the best solution.  We find users want to “play” with the recommendation like

  • Increasing and decreasing nodes to see impact on the utilization dials.  Auto provides N+1 or N+2 but good to see impact of losing a node for example
  • Would a faster processor or more RAM help a compute intense workload mix?
  • How about impact of changing storage options?

In old days you had to go to Manual, make a change, hit apply and then see the impact.  If you want to play with say 10 different changes that is a LOT of effort

Now we have Super Auto !!!

Here is an Automatic Sizing and you see there is 6 nodes.  The one thing that is new is you see the Customize link.  Click on this and you will enter that Super Auto Zone

Here is Super Auto

Key things

  • You now have + and – buttons to increment and decrement the nodes and the resources.  In regards to resources
    • Cores – You increment or decrement with more or less overall specint.  We go through the product structure for that model
    • RAM, HDD, SSD – You increment or decrement with more or less capacity.  We go through the product structure for that model
  • Whenever you click a new sizing is done with that change in either the model or the node count.  The dials are updated
  • You see a cost delta vs optimal.  So you don’t have to go to Budgetary quote to realize relative cost change.  Here we added a node and it increased the expected net price by 15%.  It is approximate.  We have budgetary quote to get a better number
  • You see at the top, Sizer tells you it is now customized.  That will be recorded in the BOM too
  • Restore to Auto.  Here can just have Sizer go back to optimal.
  • Done.  Have fun clicking things and in the end can go with it

What about the product details when I make changes?  

Product component descriptions and quantities are too long to put in the UI by the buttons.  So we have you increment or decrement and you see the overall capacity (e.g. increase or decrease HDD).  However at any time you can look at the model description ( the i by the model) and get all that info

Scenario Actions (when sizing is near completion)

Once we have your sizing complete or near complete you can do the following with your sizing

In the upper left can click on the actions button:


For Salesforce Login: 

  • Clone Scenario – Can clone the scenario (copy of the scenario) with a unique name. Often this is done if want to leverage same scenario but make a few changes in workloads, models, etc.
  • Delete Scenario – This is used to delete the scenario. Do note it is NOT recoverable
  • Download BOM – Here a PDF is created with the recommendation, all the workload inputs, sizing details and detailed BOM.
  • Attach BOM to Opportunity – The BOM pdf for the scenario will be attached to the opportunity in salesforce.
  • Generate Budgetary Quote – The BOM is put into an excel file and shows list prices.
  • Generate Salesforce Quote – A quote can be created for the scenario BOM in salesforce for the opportunity linked to scenario.
  • Import RVTools output – This allows a RVtools output run in a customer environment to be imported into Sizer.

For My Nutanix Login:

  • Edit Scenario – Here can enter in assumptions that you have with the customer and that is kept in the BOM.
  • Clone Scenario – Can clone the scenario (copy of the scenario) with a unique name. Often this is done if want to leverage same scenario but make a few changes in workloads, models, etc.
  • Delete Scenario – This is used to delete the scenario. Do note it is NOT recoverable.
  • Download BOM – Here a PDF is created with the recommendation, all the workload inputs, sizing details and detailed BOM.
  • Generate a Budgetary Quote – The BOM is put into an excel file and shows list prices
  • Import RVTools output – This allows a RVtools output run in a customer environment to be imported into Sizer.

Rack View

There is a rack view that you can access within the scenario page.

To see the power requirements click on the upper right link

Collector

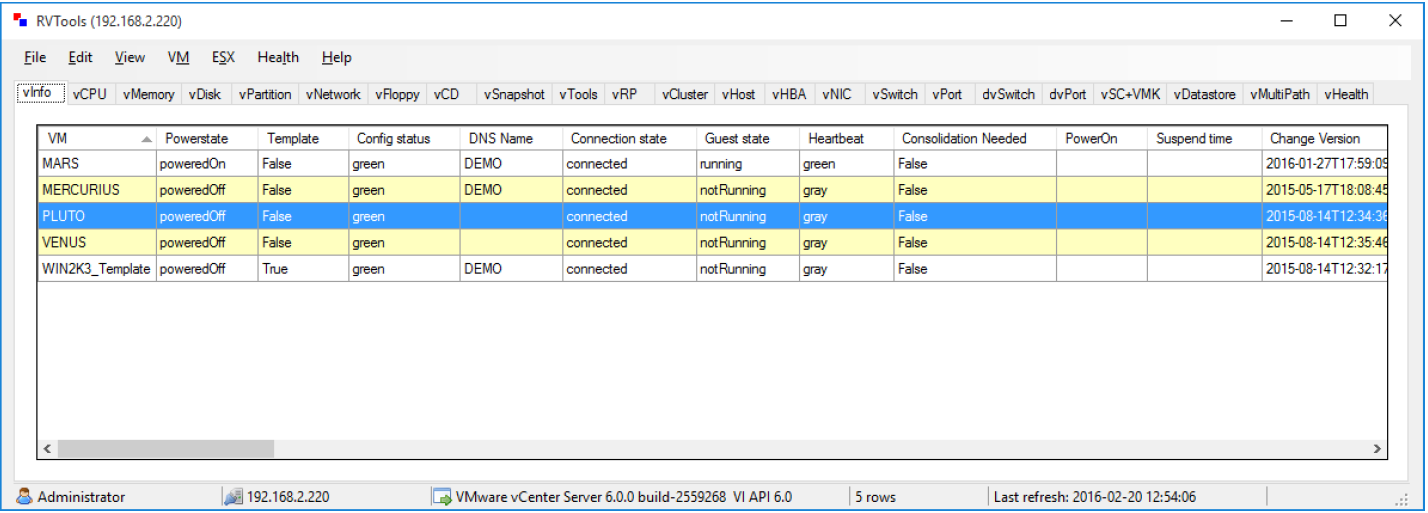
Nutanix Collector collects server virtualization workload details from customers existing datacenters.

Once connected to customer’s hosts or vCenter, the tool collects information such as number of VMs, its power on/off state, VMs configuration which includes number of cores, RAM and allocated and used capacity.

The user gets an option to save the data in excel format.

Currently, as an alternative to RVTools, the Collector output can be imported into Sizer for sizing.

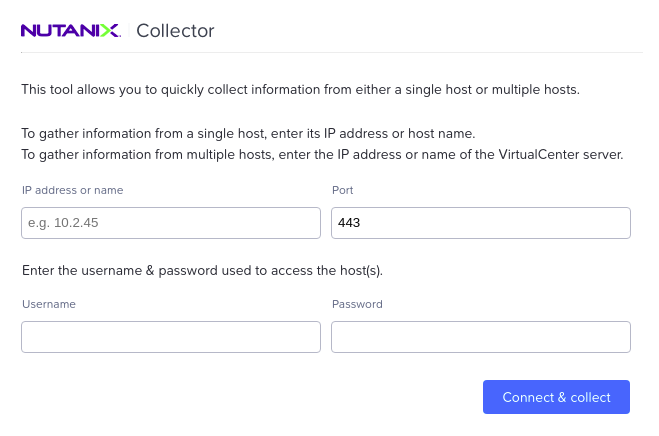
The tool requires host/vCenter IP and user credentials to login and connect (as shown)

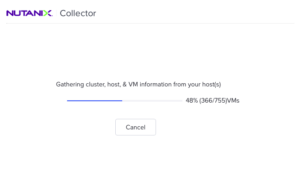
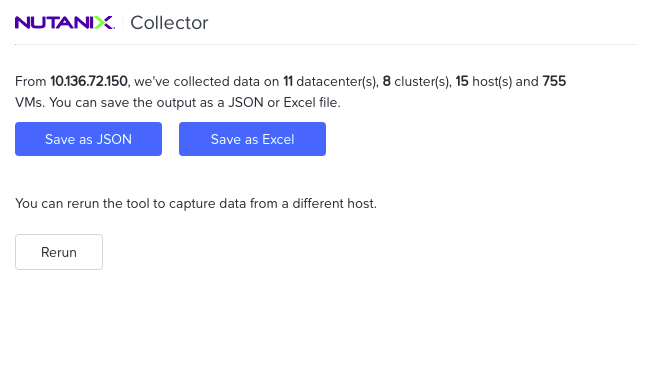
And as it collects the VM data, it shows the status of the data collected

Once the VM information is gathered, it allows the user to save it in excel  format

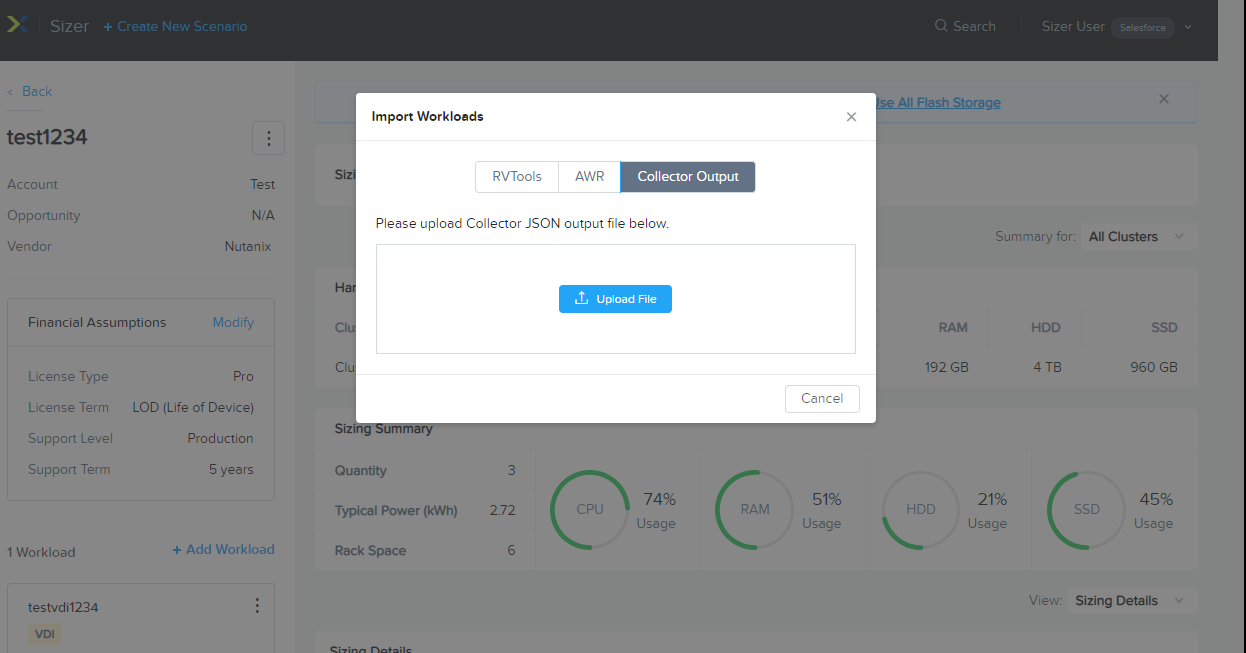
Sizer has an option to import Collector output file..

Steps for using Collector in Sizer


  • The NTNX SE or Partner SE  to install the Collector on their laptop.
    • If SE runs it on their laptop, they would need permission and cooperation with the customer to have it point to VCenter or ESX. User/password is needed and must not be blocked by a firewall.
    • If customer gives final excel output, SE still needs customer to agree that configuration can be shared.
  • Once the SE has the Excel output, they will import it into Sizer which will group most of the  VMs into one of 25 profiles.
  • Sizer will then return an excel with a Sizer_summary tab which has key information but also what profile is applied or “not covered”
  • The user should review this with the customer and especially those not covered by a profile.  They are very high in either CPU or RAM or Total capacity. Do they need to be that high? If so the user would create custom workload.


Does Sizer accounts for all the VMs imported by Collector?

No. Sizer corresponds to only those VMs for which the ‘covered’ column in Collector summary report is ‘Yes’.

There are couple of parameters based on which some VMs might not be covered and Sizer does not size for these VMs.

Powerstate flag

  • A customer may have many VMs and often some are defined but turned off are actually dormant.  Automatically sizing all VMs could cause Sizer to oversize the environment. Conversely, some of the VMs that are powered down may be applications that are used occasionally and need to be sized.
  • We use the powerstate flag.  SE should discuss with customer. If they feel it will be migrated but was off when the tool was run they should change flag to poweredOn.
  • Conversely changing that flag to poweredOff will tell Sizer to not size it

 Workload profiles

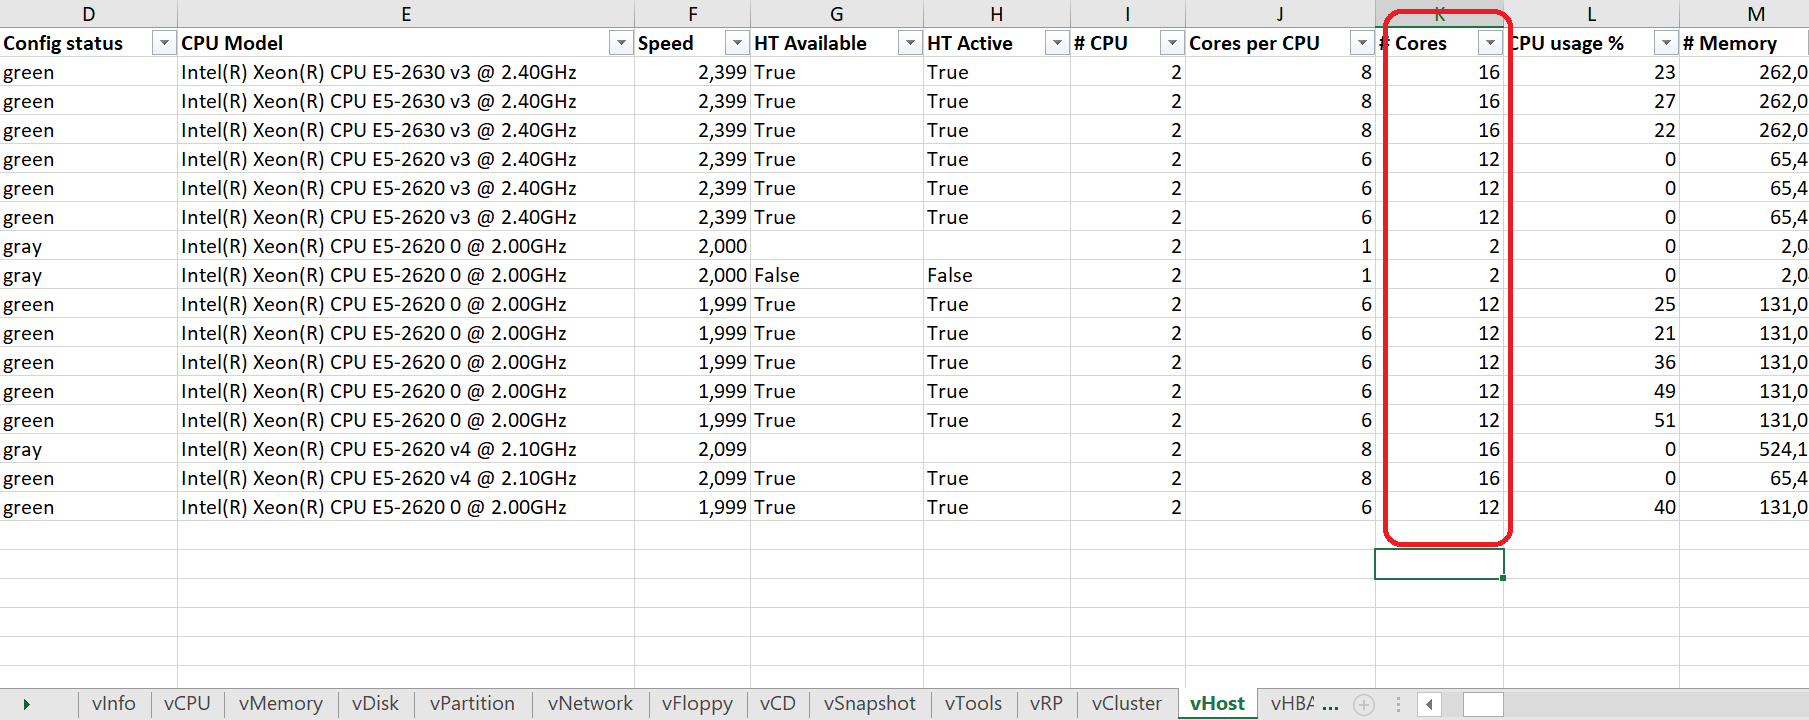
  • From vParition sheet in Collector , we read two columns – Capacity MB and Consumed MB .
  • Calculate total of Capactity MB and total Consumed MB for any VM as a VM can have multiple partitions.
  • If the VM is thick provisioned, we consider Capacity MB, if thin provisioned, Consumed MB is used for calculation.
  • Then we do Groupings of VM based on CPU and RAM (example Small CPU and Small RAM).
  • Storage capacity requirement for the group (Small CPU and Small RAM) is calculated as the average of the total capacity of the VMs that are part of the group
    • Use Capacity MB for thick provisoned VM and Consumed MB for thin provisioned VM for the calculations.
  • Sizer will try to group the VMs into one of 25 workload profiles.  If the VM has simply higher capacity, CPU, RAM requirements than any of the profiles, then Sizer will flag that for user review.  The user can either assume it was over-provisioned and go with one of the profiles or create a custom workload for that larger VM

What are the supported platforms and prerequisites for running the Collector? 

  • It has Windows, Mac and Linus versions as well as CLI. It requires network connectivity to the cluster that is being analyzed.  It would need vCenter userid and password to connect to the cluster.

How Sizer creates workload using Collector data ?

  • User will  import the Collector Excel into Sizer.  There is a upload file button on Import Workloads page.
  • Sizer will pull all the info for each poweredOn VM
  • Sizer will see if the VM fits one of the 25 profiles. It will try to fit the VM in the smallest one that still fits.
  • Sizer will then create an excel sheet with the sizer_summary tab.  It has all the info Sizer grabbed info and state the profile that was selected or “not covered”


What are advantages of Collector over RVTools?

  • Currenttly, Collector is an alternative to RVTools providing allocated resources information about the VMs and integrated into Sizer without worrying about version issues.Going forward, Collector will have lot more information on the VMs usage pattern such as utilization rate of the resources namely core,RAM,capacity over time which can range from a day to a week or a months’ worth of data.  There are other metrics that will be captured such as IOPS , IO size , latency which will go a long way in sizing the cluster more effectively.

Does it work with Sizer ?

Yes, Sizer has an import feature where you can upload Collector output

How does it store the collected data ?

It provides options to save the collected information in Excel format.

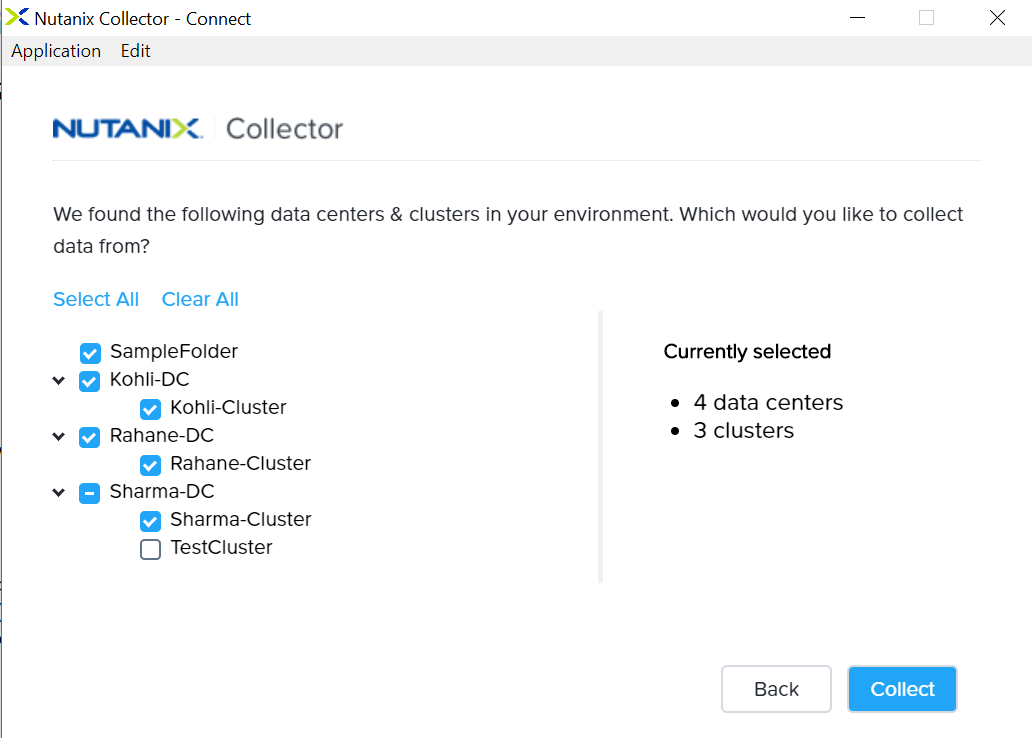
Can we filter on datacenter/cluster which are potential refresh targets for collection? 

Yes, with the new Collector  , you can select the datacenter/cluster for which you want the VM info collected. This way you can avoid fetching VM info for all the clusters which are part of the vCenter.

Do we have a CLI option ?

Yes, there is a CLI version of Collector for the CLI entusiasts.

Is it available for the customers ?

Currently, it is targetted for our SEs to run it at the customers’ site since today it is a point in time snapshot, however, the later versions are intended to be customer facing.

Here is a short video giving a brief overview and a demo of the tool


RVTool Import into Sizer

RVTools overview

RVtools is a leading tool to monitor VMware clusters.  It is an free tool, that runs on Windows (.Net 4 application), can query VMWare’s  VI (Virtual Infrastructure) API to get numerous attributes. The VI API is exposed as a Web service, running on both ESX Server and VirtualCenter Server systems.

As you can see from the screenshot below, the tool has a number of tabs capturing the details in tabular format.

Steps for using RVTool in Sizer


  • The NTNX SE or Partner SE  to install the supported version of RVtools from Robware on their laptop.  Alternatively, the customer often has it installed and gives the SE the final excel file.
    • If SE runs it on their laptop, they would need permission and cooperation with the customer to have it point to VCenter or ESX. User/password is needed and must not be blocked by a firewall.   This can be a big issue and so could be best to have the customer running RVtools.
    • If customer gives final excel output, SE still needs customer to agree that configuration can be shared.
    • The command line to run the tool and create the excel output is included in this document.
  • Once the SE has the Excel output, they will import it into Sizer which will group most of the  VMs into one of 25 profiles.
  • Sizer will then return an excel with a Sizer_summary tab which has key information but also what profile is applied or “not covered”
  • The user should review this with the customer and especially those not covered by a profile.  They are very high in either CPU or RAM or Total capacity. Do they need to be that high? If so the user would create custom workload.

Does Sizer accounts for all the VMs imported by RVTool?

No. Sizer corresponds to only those VMs for which the ‘covered’ column in RVTool summary report is ‘Yes’.

There are couple of parameters based on which some VMs might not be covered and Sizer does not size for these VMs.

        Powerstate flag

  • A customer may have many VMs and often some are defined but turned off are actually dormant.  Automatically sizing all VMs could cause Sizer to oversize the environment. Conversely, some of the VMs that are powered down may be applications that are used occasionally and need to be sized.
  • We use the powerstate flag.  SE should discuss with customer. If they feel it will be migrated but was off when the tool was run they should change flag to poweredOn.
  • Conversely changing that flag to poweredOff will tell Sizer to not size it

       Workload profiles

  • From vParition sheet in RV tools , we read two columns – Capacity MB and Consumed MB .
  • Calculate total of Capactity MB and total Consumed MB for any VM as a VM can have multiple partitions.
  • If the VM is thick provisioned, we consider Capacity MB, if thin provisioned, Consumed MB is used for calculation.
  • Then we do Groupings of VM based on CPU and RAM (example Small CPU and Small RAM).
  • Storage capacity requirement for the group (Small CPU and Small RAM) is calculated as the average of the total capacity of the VMs that are part of the group
    • Use Capacity MB for thick provisoned VM and Consumed MB for thin provisioned VM for the calculations.
  • Sizer will try to group the VMs into one of 25 workload profiles.  If the VM has simply higher capacity, CPU, RAM requirements than any of the profiles, then Sizer will flag that for user review.  The user can either assume it was over-provisioned and go with one of the profiles or create a custom workload for that larger VM.

How are the usable capacities determined for VMs?

From Vparition sheet in RV tools , we read two columns – Capacity MB and Consumed MB.

Finding capacity for Sizing: 

  • If Thin = True, then we use Consumed for Final Capacity
  • If Thin =False, then we go with Capacity for Final Capacity
  • (Note: Thin variable comes from vDisk tab)
  • We group VMs into categories such as Small CPU, Small RAM
  • We create a list of VMs for those that are Thin and those that are thick provisioned.  So we can have Small CPU and Small RAM that are thin provisioned and those that are thick provisioned.  
  • In each group in each list we then go with the max cap value of all those VMs and apply 90% HDD and 10% SSD

What are the prerequisites for running the RVTool? 

Its a windows application running on a desktop or laptop with network connectivity to the cluster that is being analyzed.  It would need vCenter userid and password to connect to the cluster.

How Sizer creates workload using RVTools data ?


  1. User will  import the RVtools excel into Sizer.  There is a upload file button on Import Workloads page.
  2. Sizer will pull all the info for each poweredOn VM
  3. Sizer will see if the VM fits one of the 25 profiles. It will try to fit the VM in the smallest one that still fits.
  4. Sizer will then create an excel sheet with the sizer_summary tab.  It has all the info Sizer grabbed info and state the profile that was selected or “not covered”

What does CPUs column mean in the RVTool sumary sheet ?

The values for the CPUs column in the Sizer summary sheet  indicate the CPU profile for the VM.

As explained above, every VM is classified as small, medium , large etc as per the vCPU count of the VM as below:

VCPU

  • Small = 1
  • Medium = 2
  • Large = 4
  • X-Large = 8
  • XX-Large = 16

On what basis is the VM  vCPU and vMemory classified ?

Below is the classification criteria for VM vCPU and memory

VCPU

  • Small <= 1
  • Medium <= 2
  • Large <= 4
  • X-Large <= 8
  • XX-Large <= 16

RAM

  • Small = <1.024GB
  • Medium <2.048 GB
  • Large <8.2 GB
  • X-Large <16GB
  • XX-Large <32 GB


What does Cores column mean in the RVTool sumary sheet ?

These indicate the total number of cores available in the host machine of the VM. These are collected in the vHost tab of the RVTool export.

What happens to the VMs which are not covered as it does not fit in one of the 25 server virtualization profiles?

Analysis has shown about 85% of the VMs fit in these 15 server virtualization profiles. For a handful of VMs that does ont fit in the profile, SEs can review the VMs with the customer. Often some VMs are over provisioned and would fit in one of the profiles.

These changes need to be made manually to the RVTool excel and imported to Sizer for a revised sizing summary.

How do I handle errors associated with importing RV tools?
Make sure you used the latest version of RVTools and that the output has not been tempered with. Also, make sure you have read/write rights on the file before uploading.

Oracle AWR support

Oracle provides Automatic workload repository (AWR) , a diagnostic tool with Oracle as a licensed feature.  This feature is available on all OS platforms. Solaris , AIX , HPUX ,Linux and Windows and will run on all the platforms.

Nutanix has a platform agnostic script (.SQL) which is used to gather information on the server running Oracle in the following format.The script will be run by an oracle DBA/admin on multiple hosts/VMs and a similar output (dbname.out) is obtained depending on the situation.  Multiple dbnameXX.out files are generated, one per database.

If we are provided a mixed output of .out files from AIX , Solaris , HPUX or Linux , we should be able to put these together into an Excel sheet and size it.

The user can then import the awr .out file or a zip file with multiple awr files (more common) into Sizer

Sizer will then do two things :

  • Process the awr file(s) and create appropriate oracle workloads per this document
  • Provide user with an excel summary file with details on the resulting workloads

AWR file structure

 AWR files do end with .out file extension but are text files. Here is a sample

This sample shows one clustered database where same database is run on multiple hosts.  

Information in an AWR we use for sizer

    • NUM_CPU_CORES_PER_NODE – this is used to determine cores in Oracle workload.
    • INSTANCES – will tell us if clustered when greater than 1
    • DB_NAME – used to name the Oracle workload
    • TOTAL_CORE_COUNT –  Not used as not always in AWR
    • HOSTS – This is needed to determine cores for the Oracle workload
    • PHYSICAL_MEMORY_GB_PER_NODE –  this will be the RAM requirement in the workload.  
    • Database_SIZE_GB –  this will be the database storage.  

How does Sizer come up with the core/ram/storage requirement for the given AWR file (or multiple files in a zip)

Each DB instance (per .out file) is a workload.  Its core/ram and capacity requirements from the awr file becomes the sizing requirements for that workload. 

However, a key point to note here is that due to  the way Oracle is licensed [for the entire cores of the host],  multiple DB instances on the same host are not treated as separate workload with separate core/ram requirements. The workload is at host level with the core and ram for the host as the core and ram requirements for the workload. The storage capacity across all DB instances on the host becomes the stoarge requirement for the workload.